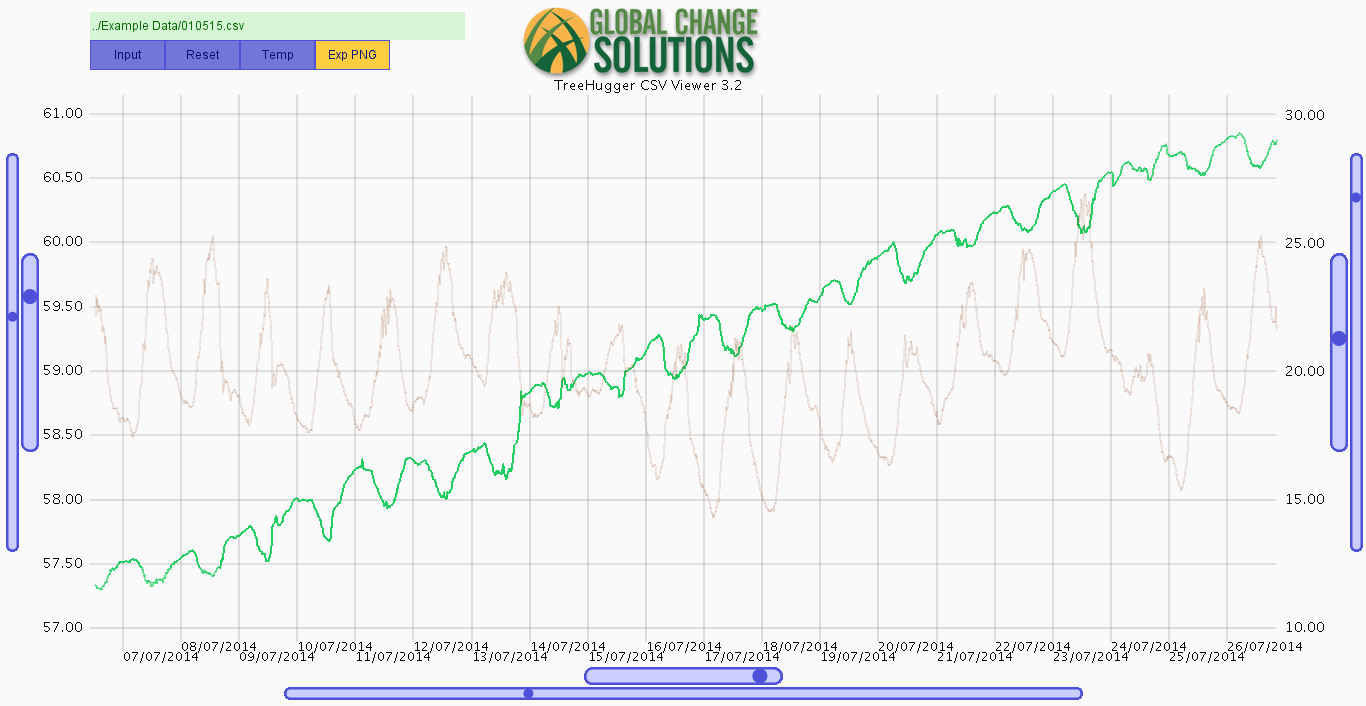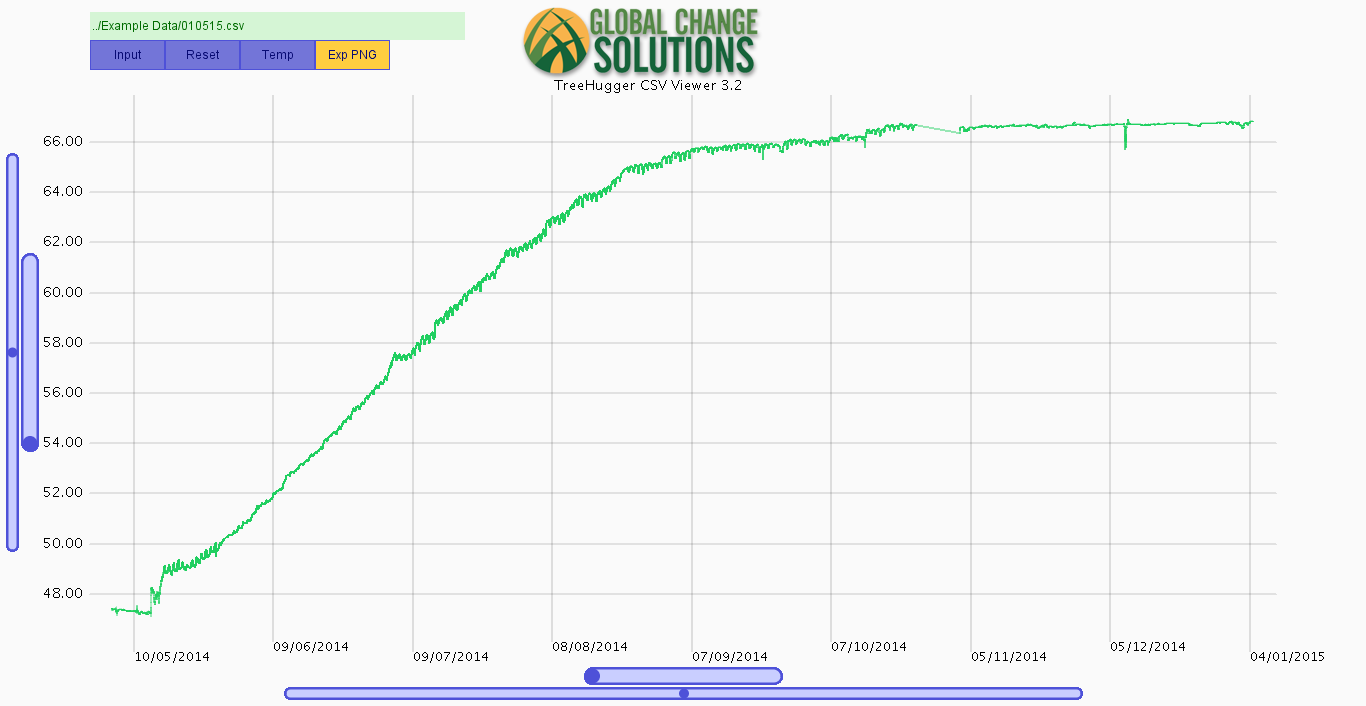
The GCS CSV Viewer allows quick and easy interaction with recorded data. The user is able to zoom and pan along each axis. Dragging a box over the graph zooms to the selected region. Temperature data can be displayed on the secondary Y axis by toggling the TEMP icon. Select EXP PNG to export a .png screenshot of the current window.
Download the GCS CSV Viewer here.